Neuroimaging
For a review of the neuroimaging of FTD read this paper by Elizabeth Gordon who is an alumni of our team.
Brain imaging is helpful in making a diagnosis of FTD but it is also being used in trials as a way to understand whether drugs are working or not.
CT imaging
For making a diagnosis, our experience is that CT scans are less helpful and can sometimes be interpreted incorrectly. We see some people in our clinic who have been told they have brain atrophy of the frontal lobe based on a CT scan but this turns out not to be the case when the scan is reviewed and more detailed imaging performed.
Magnetic resonance imaging
The majority of brain imaging studies in FTD have used magnetic resonance imaging (MRI). A volumetric scan is most helpful. This is where slices are taken every 1mm through the brain rather than the standard 1cm. We look at whether there has been any loss of brain cells or atrophy within the frontal and/or temporal lobes. This is commonly asymmetrical, in other words, worse on one side than the other.
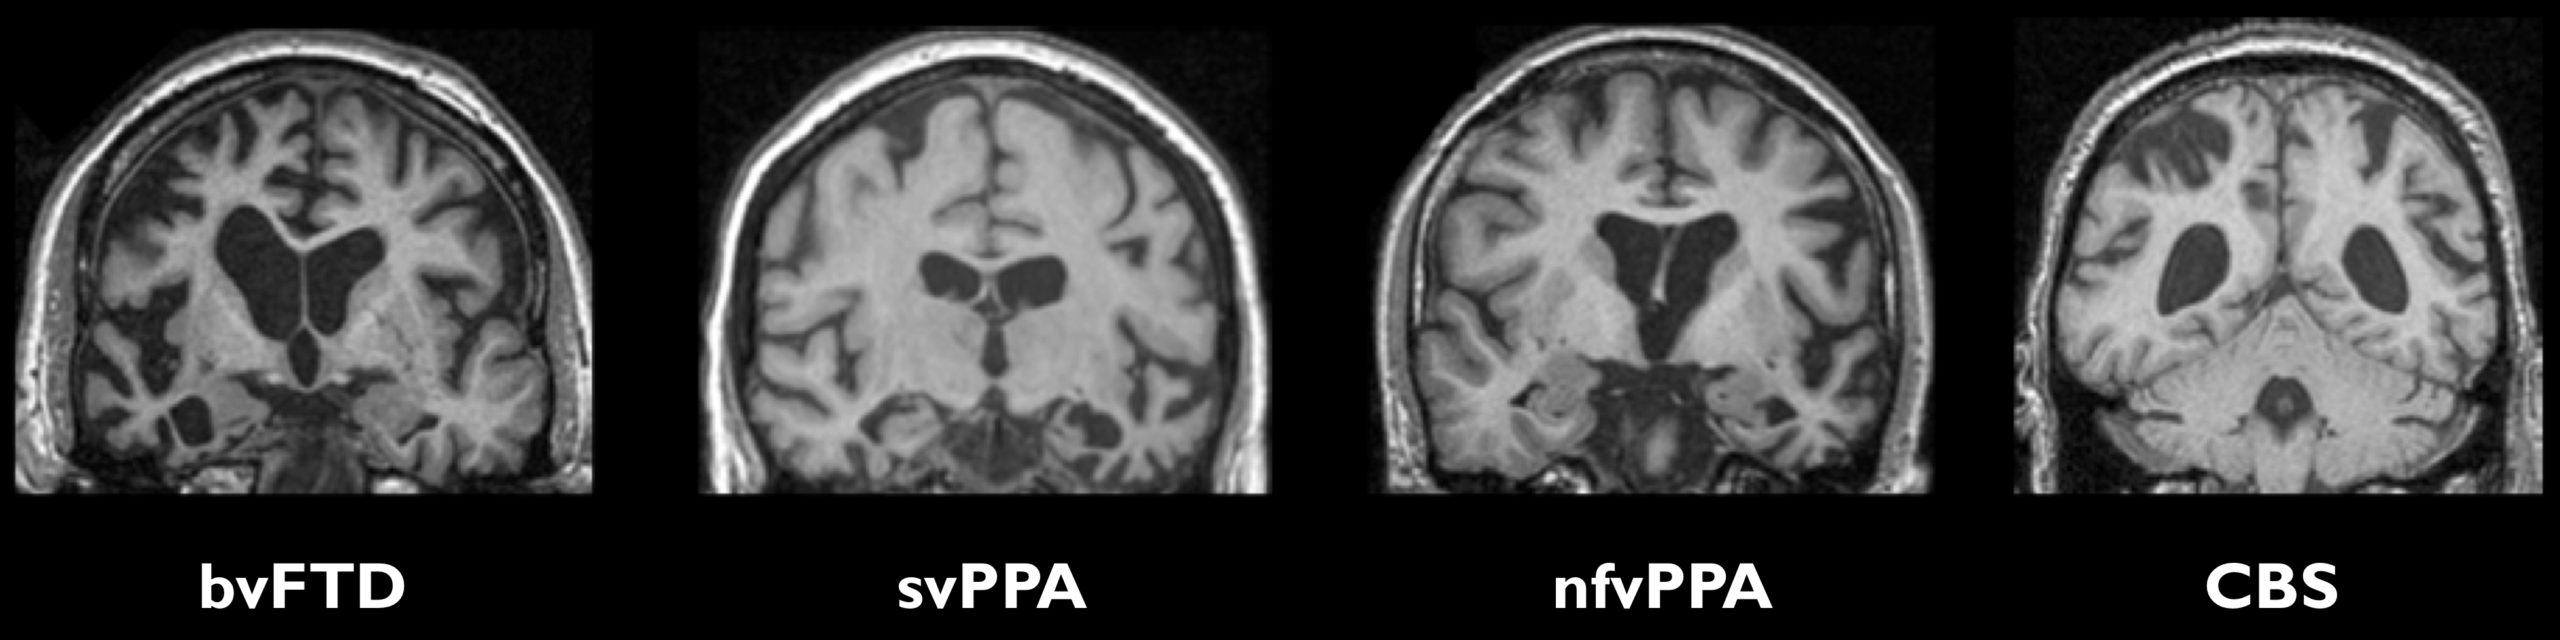
The classical features in the different clinical syndromes are:
- BvFTD – atrophy of the frontal and/or temporal lobes, often more on the right than the left.
- SvPPA – anterior and inferior temporal lobe atrophy, usually more marked in the left hemisphere.
- NfvPPA – left inferior frontal lobe and insula atrophy.
- LvPPA – left posterior superior temporal and inferior parietal lobe atrophy.
- CBS – asymmetrical frontal and parietal lobe atrophy.
- PSP – midbrain atrophy – presence of the ‘hummingbird’ sign, reflective of the loss of midbrain with preserved pons.
Beyond this simple description lies a more complex picture of changes on MRI scans, particularly for bvFTD:
- Involvement of two areas next to the frontal and temporal lobes called the insula and anterior cingulate occurs in the majority of people with bvFTD.
- Some people with FTD have a more generalised pattern of brain involvement that includes the more posterior regions of the brain including the parietal lobes. This makes FTD harder to diagnose as the imaging pattern does not fit what is described in the criteria for diagnosis.
- There is early involvement of subcortical structures in most people with FTD – these are brain regions below the surface of the brain and include the hippocampus, amygdala, basal ganglia, thalamus, hypothalamus and habenula. Involvement of the cerebellum is less common but is seen particularly in those with C9orf72 mutations.
- Whilst the majority of people have asymmetrical atrophy, some people with FTD have relatively symmetrical volume loss, particularly those with C9orf72 and MAPT mutations.
- Rate of brain atrophy is variable between the different forms of FTD. For example, in genetic FTD rates of brain atrophy are fastest in those with GRN mutations (~3.5% loss of the whole brain per year) and slowest in MAPT mutations (~1.5%). Those with C9orf72 mutations have more variable rates of atrophy with some people progressing quickly and some very slowly.
Positron emission tomography
Less is known from a research perspective about positron emission tomography (PET) imaging in FTD but it is commonly used in the clinic.
FDG-PET imaging shows hypometabolism in the frontal and/or temporal lobes in people with FTD. This can be present before atrophy can be seen on an MRI scan. However, hypometabolism without atrophy can also be seen in psychiatric disorders.
Amyloid PET imaging is a way of finding out if someone has underlying Alzheimer’s disease, in a similar way to some of the CSF markers. This type of imaging is normal in the majority of people with FTD or PPA but is abnormal in most people with lvPPA.
Single-photon emission computed tomography (SPECT)
Similarly to PET, few research studies have looked at SPECT in FTD.
Frontal and/or temporal hypoperfusion can be seen in FTD but the same issues arise as for FDG-PET imaging.